Showing posts with label Irish deposits. Show all posts

Friday, October 30, 2015

30/10/15: Repaired Irish Banking: Betting Your House on Corporate Deleveraging


I have not been tracking more recent changes in Irish banking sector aggregate balance sheets for quite some time now. However, preparing for a brief presentation on Irish banking crisis earlier this week, I had to update some of my charts on the topic. Here is some catching up on these.

Take a look at Central Bank’s data on credit and deposits in Irish banking system. These figures incorporate declines in both due to sales of loan books by Irish banks, so step-changes down on credit lines reflect primarily these considerations. As superficial as the numbers become (in this case, the aggregate numbers no longer fully reflect the true quantum of debt held against Irish households and companies), there are some positive trends in the figures.


  1. Over the 3 months through August 2015 Irish households have reduced the level of outstanding debt by some 7.1% compared to the same 3mo period in 2014. Total level of household debt now stands at the average of December 2004-January 2005. This is a massive reduction in debt burden, achieved by a combination of repayments, defaults and sales of loans to non-banking entities (e.g. vulture funds). However, loans for house purchases have declined by a more moderate 4.5% over 3mo through August 2015 compared to the same period in 2014. This brings current pile of house mortgages outstanding to the average level of February-March 2005. Which is impressive, but, once again factoring in the fact that quite a bit of these reductions was down to defaults and sales of loans, the overall organic deleveraging has been much slower than the chart above indicates. Over the last 3 months (though August 2015), total volume of household debt declined, driven down by deleveraging in mortgages debt and ‘other debt’ against a modest increase in consumer credit. It is interesting to note that over the last 12 months (based on 3mo average), volume of ‘other loans’ has dropped by a massive 38%, suggesting that this category of credit is now also subject to superficial debt reductions, for example originating from insolvencies and bankruptcies. For the record, there are at least three highly questionable reductions in recorded household debt on record: November-December 2010 drop of EUR7.5 billion, September-October 2011 drop of EUR17.2 billion, and May-June 2014 decline of EUR4.1 billion. This suggests that the official accounts of household deleveraging may be overstating actual degree of deleveraging by upwards of EUR28 billion which could bring our debt levels back to September-October 2011 and signify little material reduction in total debt over recent years.
  2. Over the 3 months through August 2015, loans outstanding to the Non-financial corporations in Ireland fell 19.4% compared to the same period average in 2014. Most of this decline was driven by the 19.5% drop in loans, with debt securities outstanding declining by only 5.7%. This marks 12th consecutive month of m/m declines in credit outstanding to the corporate sector. Current level of corporate credit brings us back to the levels last seen in 3Q 2003. Just as with households there are at least 3 episodes of significant declines in credit volumes since the start of the Global Financial Crisis, although the path for corporate loans has been more smooth overall than for household debt. This suggests that banks have prioritised resolving corporate arrears over household arrears, as consistent with 2011 PCAR strategy that also prioritised corporate loans problems. 


Total credit outstanding to the real economy (excluding Government and financial intermediaries) has fallen 12% y/y in the three months through August 2015. The official register now stands at EUR145.3 billion, a level comparable to the average for June-July 2004.The truly miraculous thing is that, given these levels of deleveraging, there is no indication of severe demand pressures or significant willingness to supply new credit.

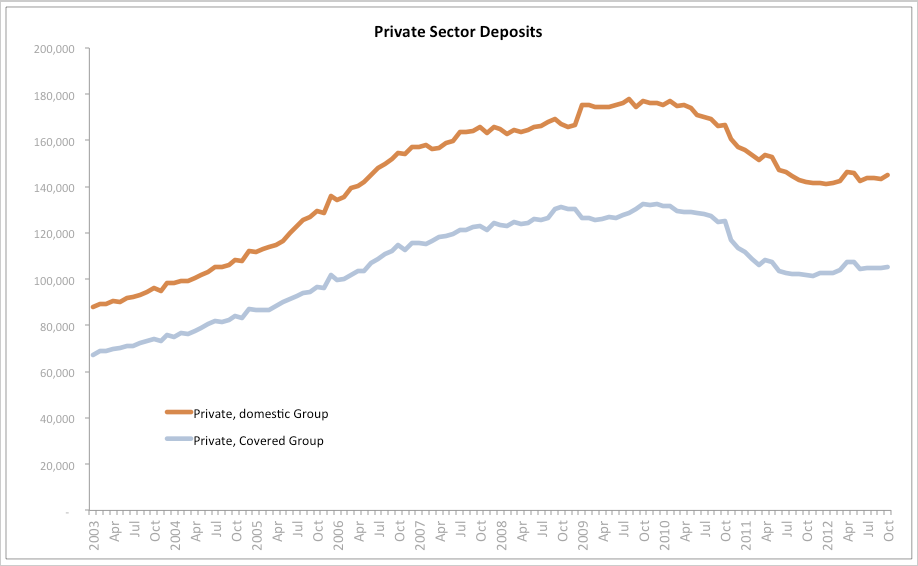
As shown in the chart below, Irish banking sector overall has been enjoying steadily improving loans to deposits ratios.


Over the July-August, household loans to deposit ratios dropped to 99% - dipping below 100% for the first time since the Central Bank records began in January 2003. Loans to deposit ratio for non-financial corporates declined to 120% also the lowest on record. However, this indicator is of doubtful value to assessing the overall health of the financial sector in Ireland. To see this, consider the following two facts: household loans/deposit ratios have been below pre-crisis lows since October 2011, while corporate loans/deposits ratios have been below pre-crisis lows since July 2014. Reaching these objectives took some creative accounting (as noted above in relation to loan book sales), but reaching them also delivered practically no impetus for new credit creation. In other words, deleveraging to-date has had no apparent significant effect on banks willingness to lend or companies and households willingness to borrow.

By standards set in PCAR 2011, Irish banks have been largely ‘repaired’ some months ago. By standards set in PCAR 2011, Irish banks are yet to start their ‘participation in the economy’.

Meanwhile, take a look at the last chart:


As the above clearly shows, Irish banking system is nothing, but a glorified Credit Union, with credit outstanding ratio for household relative to corporates at a whooping 177%. This, again, highlights the simple fact that during this crisis, banks prioritised deleveraging of corporate debt and lagged in deleveraging household debt. Irish economic debt burden, thus, has shifted decisively against households.

Someone (you and me - aka, households) will have to pay for the loans write downs granted to companies over the years. And the banks are betting the house (our houses) on us being able to shoulder that burden. 


Sunday, February 1, 2015

1/2/15: Oh, those largely repaired Irish banks...


What do foreign 'experts' like BofE Mark Carney forget to tell you when they say that Ireland's banking system has been [largely] repaired?

Oh a lot. But here are just two most important things:


Both, in level terms and in growth terms, Irish banks remain zombified. 'Repaired' into continuously shrinking credit supply and stagnant household deposits base, the banks have been flatlining ever since the beginning of the crisis. In the last 6 consecutive quarters, household deposits posted negative rates of growth - a run of 'improvement' that is twice longer than the 'recovery period' of Q3 2012 - Q1 2013 when the deposits rose (albeit barely perceptibly).  Meanwhile, credit continues to shrink in the system with not a single quarter of positive growth (y/y) since Q4 2009. In four quarters through Q3 2014, credit for house purchases shrunk at just around 3.05% on average - the steepest rate of decline since the start of the crisis.

"Yep, [largely] repaired, Mr. Carney", said undertaker firming up the dirt on top of the grave...

Saturday, September 27, 2014

27/9/2014: Growth... just not in Irish deposits...


Here's an interesting question: when economy grows, what happens with the household deposits? The right answer is: it depends on a couple of factors:

  1. How long has economy been growing: if we have growth over a month or two, one can safely assume that households are using up cash to cover their short term debts accumulated over the course of the downturn. Indeed, Irish debts have been shrinking, not growing over the downturn - on aggregate - and growth has been ongoing for a long time now, at least in official accounts.
  2. What type of growth we are seeing: if economy grows outside the household sector, e.g. via corporate profits that do not 'trickle down' into the real economy in higher wages, etc, then deposits will not follow growth, although this effect too should be short-lived.
So what happened so far with irish households? Here's a chart:


Since Q1 2011, when the current Government came to office and promptly declared yet another economic turnaround miracle, Irish household deposits are down EUR2.08 billion or 2.23%. Worse, household deposits have been running at a flat trend since mid-2011. 

Total private sector (excluding financial firms) deposits are currently only EUR1.289 billion ahead of Q1 2011 average - a miserly increase of just 1.13%. Given Irish firms and households are still pretty much abstaining from investing in the economy, this shows the current recovery to be almost entirely concentrated in the sectors that ship profits out of Ireland with the balance of domestic growth being fully consumed by the debt servicing and repayments. 

Ah, and do note that any talk about 'rising deposits' in Irish banks that we occasionally hear from our politicians is down to one thing: inclusion of the credit unions' deposits into Central Bank statistics. As shown above, absent that, deposits still remain near crisis-period lows: household deposits today are only 1.1% above their crisis period lows, while non-financial corporates deposits are 1.22% above their crisis period lows. And as of July 2014, Irish household deposits fell in 3 months in a row. Just as growth 'accelerated'. 

Monday, July 28, 2014

28/7/2014: Of Savings, Cash and Hedge Funds...


The current crisis, on monetary aggregates side, can be characterised by the rising prevalence of cash over savings. In other words: shrinking stock of credit and deposits relative to cash.

The current crisis, on media commentary side, can be characterised by the endless talk about high savings rates in the private sector.

Here is the problem: savings = inflows into stock of savings (aka, deposits) or investment or divestment out of loans (including forced restructurings, bankruptcies, insolvencies and foreclosures). We know that Irish investment is not growing at the rates worth even mentioning. Which means that Either deposits should be growing to reflect 'high savings' or debt should be shrinking.

Take a look at the difference between M3 money supply and M1 money supply.

By definition:

  • "Money Supply (M1) to euro area -M1 is the sum of overnight deposits and currency issued (this comprises the Central Bank's share of euro banknotes issued in the Eurosystem, in proportion to its paid-up shares in the capital of the ECB, plus coin issued by the Bank less holdings of issued euro banknotes and coin by the MFI sector). " 
  • "Money Supply (M2) to the euro area -M2 is the sum of M1 plus deposits (with agreed maturity of up to 2 years; redeemable at notice of up to 3 months and Post Office savings bank deposits)."
  • M3 is M2 plus deposits with maturity over 2 years.
So the gap between M1 and M3 is deposits.


The M3-M1 gap has fallen since the onset of the crisis. It has fallen along the steady trend line, with some volatility around the dates of banks recapitalisations. And it continues to fall. In fact, between December 2013 and May 2014 we have the longest uninterrupted decline in deposits in history of the series. Current level of the gap is sitting only EUR7 billion above the all-time historical record low. In fact, during this 'historically high savings rates' period, Irish monetary system has managed to reduce the stock of deposits, compared to pre-crisis levels, by EUR85.91 billion.

But while savings (deposits) are falling, 'savings' (debt deleveraging) is all the rage:


You can see what has been happening in the Money Supply territory and private credit here:


With all of these 'high savings' promoted by the official statistics and 'new lending' promoted by the Banking Federation, the Central Bank is now officially giving up on getting those 'repaired and recapitlaised banks' to lend into the real economy (something they were supposed to do since early 2009 - based on the promise of the October 2008 Guarantee, then since early 2010 - based on the various Government programmes, then since first half 2011 - based on the banks recaps and PCARs, then since 2012, based on Government programme agreed with the Troika, then since early 2013, based on Government spin of a turnaround in the economy...). Instead of hoping for the Pillar Banking System to miraculously come back to life, the Central Bank is opening up the floodgates for the hedge funds (here courtesy of fire sales of assets by Nama) to lend into economy, despite the fact that such lending is considered to be a high-risk activity. Nothing like selling pennies on the euro and then celebrating euros on pennies debt reload...


Wednesday, May 21, 2014

21/5/2014: Irish Credit Supply to Cash Ratios are Heading South, Still

Irish Central Bank and Government departments have been pushing hard to convert Irish economy into cashless, electronic accounting data storehouse, where everything gets counted and taxed (at least in theory).

Meanwhile, in Ireland's real economy, cash remains the king as the only metric of money supply still expanding in the deleveraging hell gripping the financial system:


To remind you: in Q4 2013, Irish private households' deposits fell to their lowest point since March 2009 (note, this makes them the lowest since around Q3 2005 as current figures reflect addition of the Credit Unions deposits to the dataset (they were not counted in until January 2009).

That's right... let's do away with cash so Irish banks deposits get another superficial (accounting) boost and few million worth of tax euros flows into the state coffers. Happy times all around... we know Irish households are getting richer and richer by day...

Saturday, December 1, 2012

1/12/2012: Much Hype on Little Signs: Private Sector Deposits in October


Much hoopla is doing rounds these days about the 'rise in October deposits' in irish banking system. Head of the Department of Finance has referenced the 'welcome news' in his most recent speech and the Central Bank has cheerfully noted as much in the release published last night. Alas, as usual, the reality is not as encouraging as the 'Green Jerseys' crowd might suggest it is.

Let's cut some fog of numbers here.

First, Domestic Group of banks:

  • Total Deposits in Domestic Group of banks (covering all banks registered to operate in Ireland) rose from €206,363mln in September to €208,633mln in October. In other words, deposits rose 1.1% m/m (reversing a -0.19% contraction m/m in September 2012).
  • However, total deposits in Domestic Group are down 16.6% y/y in October 2012, oops... volatility in m/m figures seems to be clouding the minds at the 'Green Jerseys' clubhouse. And worse:
  • More worrying: 3mo average deposits through October 2012 are down 7.9% on 3mo average deposits through July 2012, and are down 16.8% on 3mo average through October 2011. 
  • Likewise, 6mo average through October 2012 is down 10.0% on 6mo average through April 2012 and is down 15.4% on 6mo average through October 2011.
  • Some might say that these averages are down because of some exits of banking institutions from Ireland, but that is simply false, as data for Covered Banks (see below) shows an even more disastrous trend.
  • Now, October 2012 levels of total deposits from Irish Residents are down 16.6% on October 2011, down 31.2% on October 2010 and down 32.8% on October 2009. Only Borat would cheer these trends with a 'Good news' headline.
Much of the above data trends is driven by the Monetary & Financial Institutions deposits changes. Much, but not all. 
  • Government deposits with Domestic Banks rose 25.9% m/m in October having posted a 6.0% rise in September 2012. Year on year, Government deposits are up 44.8% in October 2012 and they were up 2.4% in September 2012. Virtually all trends on Government deposits are up.
  • In contrast, Private Sector deposits with Domestic banks grew only 1.16% m/m in October 2012 and 2.2% in September 2012. 
  • In longer term trends, Private Sector deposits didn't fare that well: 3mo average through October 2012 rose 0.06% on 3mo through July 2012, while it was up 0.73% y/y. 6mo average was up 1.2% in October 2012, compared to 6mo average through April 2012, but down 1.25% in y/y terms.
  • Now, for dysmal science analysis of the Private Sector deposits: in october 2012, Private Sector Deposits in Domestic Group of banks were up 2.2% on October 2011, down 13.0% on October 2010 and down 18.0% on October 2009.
  • Borat back, please.
Let's take a look at the levels of change in Domestic Group deposits:
  • Cheerful increase in total Irish residents' deposits in Domestic Group of banks amounted to €2,270mln in October compared to September 2012, with only €923mln of that - less than half - accumulating in Covered Banks. Looks like foreign banks are beating Irish zombies in the deposits gathering game.
  • There was a rise of €1,663 million in Private Sector deposits in the Domestic Group of banks in October, compared to September. Of this, only €574mln - roughly one third - landed in Irish banks, with 2/3rds going to foreign banks.
  • Borat would say that the above shows success in restructuring Irish banking system. More even-headed analysis suggests success in foreign banking system operating in Ireland.
Now, Covered Banks (aka Irish Banking Zombies):
  • Total Residents' deposits in Covered Banks were up €923 million in October 2012 (+0.59%) m/m, reversing a -0.01% decline in September. Y/y deposits are down 19.63% - worse performance than in September 2012 (-19.26%).
  • Let's put things into perspective: in a year to October 2012, Irish Residents' deposits in Covered Banks shrunk €38.5 billion. In the 'cheers inducing' month of October 2012 they rose €923mln. Simple math suggests that it will take us 48 months of these 'improvements' to get back to where Irish Residents' deposits were back in October 2011.
  • But there's more: Total Residents' deposits in Covered Banks in October 2012 were -19.63% below October 2011, -36.35% below October 2010, -37.64% lower than in October 2009. You get my point - Covered Banks (which were supposedly reformed, repaired, recaped per Department of Finance & CBofI, ages ago) are still performing woefully worse than foreign banks operating in Ireland.
  • Government deposits with Government-owned banks rose €695 million m/m in October (+27.2% m/m and +45.92% y/y), outstripping increases in private deposits of €574mln (+0.55% m/m and +3.3% y/y).
  • Private Sector Irish Residents' deposits with Covered Banks fell -0.75% on 3mo average basis through October 2012 compared to 3mo average through July 2012, although these are up 2.80% y/y. On another positive note, 6mo average for Irish Residents' Private Sector deposits with Covered Banks rose 1.8% on 6mo average through April 2012.
  • Nonetheless, Irish Residents' Private Sector deposits with Covered Banks in October 2012 were still down 15.8% on same period of 2010 and down 20.7% on same period 2009.
  • Switching back to more positive bit of news: Private Sector deposits with Domestic Banks were up €3.121bn in October 2012 y/y, and up €3.379bn for deposits with Covered Banks, which means that y/y Irish Covered Banks are generating stronger activity in attracting Private Sector Residents' deposits than foreign banks.
Here are some charts illustrating the above trends:


Monday, October 31, 2011

31/10/2011: IRL5 banks - no signs of real improvements in September

Few posts back I looked at the latest data for Irish banking system stability from the CBofI. Here, I complete my analysis by focusing on 5 covered institutions or IRL 5 (previously known as IRL 6 before the merger of Anglo & INBS into IBRC).

Here's the data:

  • Borrowing from the euro system by IRL5 has risen from €68,430mln in August to €70,340mln in September. Year on year, this is still down 4.73% or €3,489mln, but at that rate of unwinding IRL6 liabilities to euro system will take, oh, some 20 years (!)... Mom, the increase in borrowing from the euro system was €1,910mln or more than 50% of the reductions achieved yoy.
  • Deposits from Irish residents in IRL6 were up from €192,431mln in August to €193,929mln in September, prompting cheers from the Irish Times and Department of Finance, among others. Mom rise of 0.78% or €1,498mln contrasts a 22.22% decline yoy in very same deposits or €55,393mln loss. In other words, to get us back to September 2010 levels (not exactly healthy ones) at current rate of mom increase would take 37 months. In the last three months, on average, deposits were down €26,337mln compared to 3 months through June 2011 (-12.05%).
  • The mystery of rising deposits is explained easily by looking at their composition: Monetary and financial institutions (aka other banks) have seen their deposits in IRL5 rising €1,298mln in September (+1.47%) mom, although these deposits are down €32,308mln or -26.53% yoy. This explains 87% of the entire increase in the overall deposits.
  • In addition, General government deposits also rose €333mln in September (+16.28%) mom, explaining the remainder of the rise in overall deposits, heralded by our Green Jerseys as 'signs of improvement/stabilization' in Irish banks.
  • In contrast to the above two sub-categories, private sector deposits in Irish banks (IRL 5) have shrunk in September by €133mln (-0.13%) mom and are down 18.12% (-€22,589mln) yoy. September marked 5th consecutive month of declines in private sector deposits, which have shrunk by €6,135mln since April 2011.


As mentioned above, borrowings from the euro system have gone up in September. In contrast, as shown in the chart below, total borrowing from the ECB & CBofI have declined slightly in September to €123,596mln from €124,379mln in August (a mom drop of 0.63%). Year on year, the borrowings are still up massive €28,572mln or 30.7%. Over the last 3 months (July-September), average borrowings from the euro system and CBofI declined 1.39% or €1,748mln compared to 3 months from April through June.


Loans to irish residents have contracted once again in September, reaching €294,224mln against August levels of €294,503. The declines were accounted by drops in loans to MFIs and increases in loans to the General Government (+€58mln) and Private Sector (+€95mln). hardly anything spectacular.


Now to the last bit - recall that the comprehensive reforms of the Irish banking sector envision deleveraging Irish banks to loans-deposits ratio of 125.5%. These targets were set in PCARs at the end of March 2011. back in march 2011, LTD ratios stood at 143.25% for all of the IRL6/IRL5 and 173.71% for private sector LTD ratio only. Since then, if anything was going up to the CBofI / Government plans, we should have seen at least some reductions in LTDs.


As chart above illustrates:

  • Overall LTD ratio for IRL5 at the end of September 2011 stood at 151.72% - below August reading of 153.04%, but well ahead of March 2011 reading of 143.25% and certainly much ahead of the target of 125.5%.
  • For private sector loans and deposits, LTD ratio was 174.61% in September - ahead of 174.29% in August and still above 173.71% back in March.

And the summary is: there's no real stabilization or improvement I can spot in the above for IRL5.


Sunday, October 30, 2011

30/10/2011: Irish banking - getting sicker slower in September

Is Irish banking sector getting slowly better - as numerous articles, including in the Irish Times are suggesting on the back of the Central Bank data for September, or is it getting worse slower?

Consider CBofI data for 18 banks, plus numerous credit unions operating in Ireland. In this post we shall cover the entire domestic group of banks, with IRL6 guaranteed domestic banks to be covered in the follow up post.

The first metric by which our banking system is allegedly doing much better now days is deposits. Apparently, in recent month the flight of deposits from Ireland has been reversed. Charts below illustrate:
 Total system-wide liabilities in September 2011 stood at €659,387 mln or €895 mln up on August, but €108,011 mln down on September 2010. So mom we are up 0.14% while yoy we are down 14.07%. Over the 3 months July-September 2011, there were on average €10,704 mln less in liabilities in the system than in the 3 months from April through June. Nothing to conclude about the 'health' of the system yet, before we look at the liabilities breakdown.

So deposits then. Shall we start at private sector deposits?

Total private sector deposits in the system of all banks operating in Ireland have declined from €166,152mln in August to €163,992mln in September (down 1.3% mom), the same deposits are down 6.43% (or -€11,267mln) yoy. July-September average deposits in the system were 1.59% (€2,679mln) below those for 3 months between April and June 2011. So by all metrics here, the system deposits are shrinking.

This shrinking is captured by declines in overnight deposits and deposits with maturity of less than 2 years. Deposits with maturity over 2 years have increased from €10,843mln in August to €10,946mln in September, marking second consecutive monthly increase, this time around - by a whooping 0.12%. Yes, that's right, the first time we discover anything of an increase is in the smallest sub-component of deposits and that is a massive 0.12%.

Yet, we keep hearing about increases in deposits. So let's take a look at all deposits in the system across all banks operating in Ireland:

Chart above provides breakdown of all deposits in the system. This shows:

  • Total deposits in the system stood at €248,861mln in September or 18.12% below their levels in September 2010 (-€55,061mln), but a massive 0.09% up on August 2011 (mom increase of overwhelming €225mln). Quarter 3 average deposits were 10.15% below quarter 2 average deposits (of course most of this decline is due to Government deposits being converted into capital by banks)
What explained this miracle of rising deposits in the system? Was it private sector (productive economy) newly discovered riches or restored confidence in Irish banking system by corporations & households? Nope, remember - private deposits are down, so the increases are broken down into:
  • MFIs (inter-banks etc) deposits were up in August (celebration time, folks) from €101,780mln in August to €103,293mln in September. Impressed? That was 1.49% mom rise, that is contrasted by a 23.32% decline yoy. So in a year we lost €31,419mln in interbank deposits and gained €1,515mln in a month. 20 months left to go till we are back at September 2010 levels. Or relative to peak - we are now €48,066 mln down - so only 32 more months of celebrated increases to regain the peak.
  • Oh, another thing that drove our total system deposits up in September compared to August was an increase in Government deposits from €2,360mln in August to €2,740 in September. 
  • Please note that in 2011, unlike in 2010, there are also some new depositors in the private sector that are potentially channeling new dosh through Irish banks - namely, Nama. That's right, the state agency is, of course, a private company and is cash generative for now. This means that the true decline in real economy's private sector deposits was probably even more substantial than the data shows (next point)
  • Private sector deposits - the real economy in Ireland - have declined in September to €142,828mln - down 14% or €23,252mln yoy and 1.15% or €1,668mln mom. 3 months through September average private sector deposits were 4.44% or €6,720 mln below the average for 3 months through July 2011.

 Now, recall that the other metric of health of the banking sector is the Loans to Deposits ratio - the metric of solvency of the system. Recall that the Central Bank of Ireland is aiming for 125.5% ratio for IRL6 banks (more on these in the next post). So what's happening in this area? Chart below illustrates:

And, folks, we thus have:

  • Overall across the Domestic Banking Sector, LTD ratios have declined from 145.32% to 145.14% between August and September. The rate of decline that would require 182 months to deliver 125.5% benchmark for stability envisioned under CBofI reforms (note: the benchmark of course does not apply to all Domestic Group banks, just to IRL6, but nonetheless, this can be seen as a comparative metric). Year on year the ratio is up 7 percentage points.
  • In the private sector, the LTD ratio actually rose in September to 165.2% from 163.06% in August. Year on year the ratio rose 4 percentage points.


So in summary - there are no signs that things are improving or stabilizing in the broader banking sector in Ireland. The following post will look into IRL6 guaranteed institutions, but as the whole banking system goes, no confidence gained, private sector deposits are continuing to contract, LTD ratio is rising for private sector and the only area of improvement is the inter-bank deposits, which means close to diddly nothing to the economy at large. 

Monday, July 4, 2011

04/07/2011: New Deposits in Irish Banking

Subprime Lending and the Housing Bubble: Over two previous posts I examined the data for new business loans rates for households (here) and non-financial corporations (here and spreads here). This post covers the deposits – both household and corporate.

Here is what the data on new deposits telling us:

  • Rates for household deposits with agreed maturity have fallen significantly between March 2011 (1.93%) and April 2011 (1.81%). The rates are now below those for the historical average of 2.366% and crisis period average (January 2008-present) of 2.394%. 12mo MA is 1.707%. The volatility of the rates has risen during the crisis from standard deviation for historical period being 0.950 to crisis period standard deviation of 1.155.
  • At the same time, new deposits volumes have contracted sharply for households from €12,333 million in March 2011 to €7,873 million in April 2011. Historical monthly average is €12,636 million and crisis period average is €12,938 million with 12mo MA at €10,079 million. April level of new deposits is the lowest since January 2003 – the start of the series.
  • Rates for non-financial corporations’ deposits with agreed maturity have risen from 1.41% in February and March to 1.52% in April, standing still below the historical average of 2.336% and crisis period average of 2.125%, but well ahead of the 12mo MA of 1.293%. The volatility of these rates has risen sharply during the crisis to a standard deviation of 1.319 from historical standard deviation of 1.036.
  • Volumes of corporate deposits with agreed maturity have declined from €6,720 million in March 2011 to €5,170 million in April 2011. These levels compare extremely poorly against historical average of €13,739 million, the crisis period average of €11,593 million and 12mo MA of €7,277 million.

Lastly, consider the spreads between deposit rates available to the households and those available to corporate clients. Keep in mind that from funding perspective, households deposits are probably less volatile than corporate deposits. Note that standard deviations for the two types of deposits by volume were: historical 3,000.8 million for households against 4,198.09 million for corporates and this relationship remains relatively stable for the period of the crisis.

So the spread on deposit rates for households over and above corporate deposit rates has narrowed to 0.29 percentage points in April from 0.52 pp in March 2011. Historical average spread was 0.03 pp and crisis period average is 0.269 pp while 12mo MA spread is 0.413 pp.

Wednesday, March 2, 2011

02/03/2011: Village Magazine - March edition article

Here is an unedited version of my column in the current edition of the Village magazine

Top legislative/policy priorities for the new Government should focus on addressing the four crises we face – the banking sector renewal, the debt crisis, the need to dramatically reform our economy and the long-term reform of our political and governance systems. The inter-connected nature of these crises implies that some of the reforms undertaken in one of the areas, such as, for example, fiscal adjustments, will have a positive long term effect in other areas, e.g. in stimulating private sector economic growth.

Given the constraints of the space, let me deal here first with the decisions that should take priority for the new Government over 2011 in the areas of banking and finance.

EU/IMF ‘bailout’ package: the new Government will be forced, willingly or not, to renegotiate the terms of the original agreement. Given the level of debt carried by this economy courtesy of the previous Government commitments, the question of the need for such a revision of the ‘deal’ is no longer a valid one. Instead, the real question we face is what path to a ‘default’ or debt restructuring do we take and resolving this issue should be the top of our Government agenda.

Overall, there are three possible scenarios that the new Government can face in this respect.

The first one – the scenario of exogenously imposed resolution – implies that the impetus for altering the terms of the original November 2010 agreement can come from the EU itself under the auspices of the broader EFSF reforms. Under this scenario, expected eagerly by many pro-status quo or ‘do nothing’ advocates, the EU is likely to marginally reduce the cost of the EFSF funding to, say 5% from the current 5.83% and potentially extend the duration of the loans (up to 20-30 years), while creating a ‘flexibility fund’ which will make additional funding available to Ireland post-2013, but at higher rates of interest incorporating any future increases in the ECB core policy rate. In exchange for such a ‘rescue from previous rescue’ package, Ireland will be asked to accept the need for enhanced fiscal coordination– re: tax harmonization.

The second path is of structured and orderly ‘default’ involving banks debts. Under such a scenario, Irish Government should first prepare significant buffers for dealing with the funding failure in the currently insolvent banks. Since not all of our Government-guaranteed banks are insolvent, this means that the damage limitation is relatively better contained than the current full exposure scenario. In fact, an orderly restructuring will require replacing the blanket Guarantee with the one that covers fully only the deposits held in the Irish banks. This will significantly reduce taxpayers’ future exposure to the banking sector.

At the moment, the entire banking system in Ireland holds €168.3bn in deposits. However, not all of these are held in the 6 covered banks. In addition, of the above deposits, €10.5bn is held under the termed contracts with maturity in excess of 2 years. Roughly, only ca €100bn of domestic deposits are held by the Irish banks and is subject to a withdrawal demand within the next 2 years. This means that to underwrite these deposits, the Government will need a funding buffer of ca €30-50bn over the next 2 years (providing a 30-50% cover). This buffer can be provided by a combination of new currency issuance by the CBofI, NPRF funds and a stand by facility from the IMF not exceeding €5-15bn. A far cry from what the Government, alongside the EU and IMF, are planning to burn already.

Of course, the scenario means that we will need to effectively radically reduce our banks exposure to their largest lender – the ECB. This can be done by restructuring the share of Irish banks debt held by the ECB and the CBofI into a combination of a 10 year loan at a fixed interest rate of 0.5% and a haircut of, say, 40%, in effect reducing the risk of future rollovers, while cutting the overall burden of repayment and the cost of financing. Along with it, the EU/IMF should also agree to a restructuring of the €67.5bn loan extended under the November 2010 agreement into, for example, a €35bn perpetual loan at 3% pa interest rate and a €30bn loan extended for 10 years at 1.5-2% pa interest. The key in both deals should be to achieve not only a reduction in the cost of financing the quasi-Governmental (banks) and Government debt, but also cutting the overall level of gross debt assumed.

The worst-case scenario would arise if the markets were to force Ireland into a disorderly default. In this case, the markets will execute a massive sell-off of Irish Government debt preceded by a complete collapse of the secondary markets in banks debts. This will leave the ECB with some €185 billion worth of Irish banks debts that will have virtually no real market value and an unknown (but sizeable) volume of Irish Government debt which will be selling at a 20-30% discount on the face value. Both, the sovereign bonds and the banks debt markets will cease. Overnight and demand deposits will be frozen and the country will find itself in the situation where the Central Bank will have to monetize the very same costs of the orderly restructuring scenario, plus the disruptive costs of a bank run at the same time. Instead of holding the buffers of cash and committed funds it might not have to draw down in full, the ECB system will end up in a situation where all cash will have to be delivered as soon as technically possible.

It is clear that a prudent Government action should be from day one to prepare for the second, less disruptive scenario.

Following the entry into the resolution process of the banks debts, the Government should swiftly address the banks balancesheets problems. Here, the actions should follow the Swedish model and start with the abandonment of the misguided Nama-based approach. The Government should order the six banks to supply – by the end of June – a full accounting of the loans they hold, with clear indication as to the riskiness of these loans with respect of the probability of their repayment, the quality of the underlying collateral and titles. By the end of August 2011, the Government should complete detailed evaluation of this information by an independent panel of economic, property, lending and finance experts. Parallel to this, the Government should set an exact target for banks bondholders writedowns to offset at least in part loans losses in the banks. All bonds repayments and interest payouts for banks debts due for 2011 should be suspended. The balance on the expected losses net of the funds recoverable from bondholders should be financed by the purchase of the direct equity in the banks by the Government at a price for banks shares at the time of the publication of the assessment exercise. The time-frame for such closing of the balancesheet gaps should be set for no later than November 2011.

Nama loans that belonged to the banks should be valued as banks’ own in the above exercise and following the completion of the valuations, Nama should be shut and loans transferred back to the banks for management.

Subsequent deep reforms of the banks strategies and operations should be scheduled for the first quarter 2012.

Parallel to this, the Government should submit to the Dail no later than June 2011 a full draft bill dealing with reforms of our personal bankruptcy codes. These reforms should at the very least:

Make past and future loans for the purchase of personal residence non-recourse against the person of the borrower and his/her future income and assets;
Reduce the period of bankruptcy restrictions to just 2 years and complete removal of the bankruptcy history from credit history after 5 years of continued financial probity performance; Replace a blanket ban on companies directorships for individuals in bankruptcy with a restriction on their holding such directorships subject to satisfactory financial probity conduct during the bankruptcy period;
Restrict applicability of the Loan-to-Value ratio covenants in forcing the liquidation of the existent loans where the borrower continues to pay at least 75% of the interest on the mortgage.

The new bankruptcy laws should come into force as soon as possible and prior to that, the Government should impose a requirement that no state-guaranteed institution can bring new bankruptcy proceedings against homeowners.

Lastly, the Government should act swiftly to put in place an independent expert panel consisting of independent economists, financial analysts and banking experts that will function as a check on the Government decisions in the area of banking and financial services reforms. The panel should be required to provide quarterly reports and testimonies to the Dail which will be made public. The panel will have the powers to propose specific measures to the Government, to request and receive any information from the banks and financial services provider (subject to upholding the required confidentiality clauses) and question any bank official. The panel remit will only cover those institutions in which the Government holds at least a 35% stake and those that are covered by the State guarantee.

Of course, the above measures will help addressing a large share of our debt problem, effectively reducing the Government and banks’ debts, while alleviating the burden of personal debt for mortgage holders. However, other changes will have to take place in the areas of economic, fiscal and political reforms. These proposals will be outlined in a follow up article, so stay tuned.

02/02/2011: Credit and Deposits of Irish residents: January 2011


Let's get back to the credit stats released yesterday by the CBofI. This is the second post (earlier post - here - focused on foreign depositors flight), so let's update the core charts and review some monthly changes in the data.

Credit side:

  • Irish households credit contracted mom by €948mln in January 2011 (a drop of 0.73%) against a monthly contraction of 5.29% in December 2010 - so deleveraging has slowed down
  • Year on year, Irish households total outstanding debt fell to €129,370 mln in January 2011 or yoy decline of €10,392mln (7.44%) while in December yoy decline was 6.97%.
  • Irish household's outstanding mortgages amounted to €99,289mln, down in January by €289mln (-0.29%) against a monthly drop of 7.05% in December 2010
  • Year on year, mortgages were down 9.78% (or €10,766mln) in January against a yoy decline of 9.65% in December 2010.
  • Non-financial corporations outstanding debts amounted to €92,652mln in January up 0.1% mom (+€90mln), but down 35.67% yoy (-€51,363mln).
  • Total private sector credit fell 0.57% (-€1,908mln) mom in January (December 2010 saw mom decline of 0.98%) and fell 10.6% yoy (-€39,427mln) in January (December 2010 saw yoy decline of 10.73%).
So on credit side by category:
And growth rates:

Next, deposits for Irish residents (remember - non-resident deposits were highlighted in the previous post linked at the top):

  • Total private deposits down 0.82% mom (-€1,387 mln) in January and yoy down 9.05% (-€16,613 mln). Steep. Deposits were down 2.24% mom in December 2010 (8.41% yoy).
  • Households deposits contracted 0.7% mom in January (-€663mln) and 5.56% yoy (-€5,531mln). There go our 'savings rates', folks. In December 2010, yoy drop was 4.57% so things are accelerating downward. Month on month deposits were down 0.71% in December 2010.
  • Non-financial corporations deposits rose 0.12% (VAT carry overs and seasonal receipts and payments, especially for MNCs being most likely drivers) month on month (+€41mln), but were down 16.57% yoy (-€6,670mln). In December 2010 corporate deposits were down 4.93% mom and 17.42% yoy.

Now, let's consider the degree of leverage we carry in this economy:
As charts above show:
  • Leverage rose 0.26% mom and fell 1.7% yoy in January 2011 across the entire economy. In December, leverage rose 0.51% mom and fell 3.44% yoy
  • Overall leverage trend is up and currently this economy is leverage 199.32%
  • For households, leverage fell 0.03% mom and 1.99% yoy in January 2011, having fallen 0.04% mom and 2.79% in December 2010. So deleveraginng is slowing down
  • Currently Irish households are leveraged 137.69%
  • Non-financial corporations leverage was formidable 275.93% in January, down 0.02% on December 2010 and 1.99% on January 2010. In December 2010 corporate leverage was down 0.04% mom and 2.79% yoy. So deleveraging is slowing down for corporates as well.
Deposits composition by maturity:
Clearly, longer maturity has fallen off the cliff and a slight bounce in longer maturities this month follows a catastrophic drop off in months before. This cliff is a clear indication that households are moving cash into shorter maturities - either to withdraw deposits all together or as a form of short term precautionary savings. So:
  • Overnight deposits were down -0.9% (-€788mln) mom and -4.42% yoy (-€3,998mln) in January
  • Deposits with maturity up to 3 months were down -1.26% (-€197mln) mom and -6.16% (-€1,011mln) yoy in January 2011
  • Deposits with maturity up to 2 years were up 1.15% (+€780mln) mom and down -16.67% (-13,374mln) yoy.

Finally, credit cards debt fell 1.84% mom (€53.48mln) and -5.8% (-€175.81mln) yoy in January 2011. Good news for one of the most expensive forms of debt.

02/03/2011: CB data - Total deposits

In the next few posts I will be covering the data released yesterday by the Central Bank.

Here are two telling charts rarely seen side by side:
Let's spell out some numbers:
  • Total deposits from non-residents fell 36.35% year on year in January 2011 (€190.88bn) and 3.71% mom (€12.685bn)
  • Private sector deposits from non-residents fell 22.89% yoy (€22.888bn) or 0.79% mom (€0.616bn)
  • Total private sector deposits from Irish residents declined 9.05% yoy (€16.613bn) and 0.82% (€1.6387bn) mom
  • No media outlet to my knowledge told us just how much distrust in our financial system do foreigners have

Wednesday, February 2, 2011

2/02/2011: Irish interest rates

For the last post on monthly data release from the CBofI, let's take a look at the interest rates environment at the retail level.

First up - lending rates:

As of November 2010 (latest data available):
  • House purchases lending floating rate was at 2.95% (up 0.34% mom and 13.03% yoy - note, these are percentages, not percentage points); rates for over 1 year fixed were 4.10% average (up 0.24% mom and 14.53% yoy)
  • Consumer credit rate was 6.06% floating (up 1% mom and 30.32%yoy)
  • Non-financial corporations faced a floating rate for <€1mln loans of 4.49% (up 10.86%mom and 13.96%yoy) and over 1 year fixed rate for same level of loans of 5.14% (up 4.26%mom and 18.16%yoy)
  • The trends are up for all two borrower types year on year
Now, deposits:
So for deposit rates:
  • Household deposits attracted an average rate of 1.75% (up 6.06% mom and 17.45% yoy)
  • Non-financial corporations attracted an average rate of 1.25% (down 0.79% mom and up 39.98% yoy)
Now, consider the difference between deposit rate and borrowing rate:
For households, the gap between earnings on savings and cost of financing mortgages (I used house purchase, floating rate or up to 1 year fixed) has moved in favor of savers until November 2008, and there after switched in the direction of favoring borrowers. The switch is extremely volatile and since August 2010 the direction has changed once again. Thus, since August 2010 the banks are moving into more aggressively charging mortgage holders and rewarding relatively more savers.

Corporate rates differential has been moving in the direction of penalizing corporate deposits holders. This process in now being reinforced since July 2010.

So here we have it - deposit rates are becoming less attractive to the corporates, just as more and more of them abandon Irish banks... who would have thought that charging our customers out existence can be a bad thing?

Finally, using CBofI breakdown on loans by type and maturity, I conducted a simple exercise - what happens if the interest rates on new and ARM mortgages charged by banks go up by 1 percentage point (incidentally - PTSB is doing just that, apparently). By my calculation, added cost of interest finance will translate into roughly additional €1.67bn being taken out of the economy. That's like having another Leni's tax hike over again for Irish households.

2/02/2011: Irish termed deposits and credit cards

In the previous two posts I updated data on credit and deposits levels and flows. In this post, let's tidy up by taking a look at deposits by maturity and credit cards.

First deposits by maturity:
Clearly, longer term maturity is exiting, medium term maturity deposits are now shrinking as well, while short term maturity deposits remain steady. This suggests that
  1. Irish depositors are exiting Irish banks when longer term savings mature;
  2. Irish pool of savings available for investment - remember, banks can more safely lend out of longer maturity deposits than out of shorter maturity ones (lower risk of maturity mismatch) - is also shrinking.
  3. Overall, overnight deposits have increased 2.11%mom in December 2010, but fell 4.35% yoy
  4. Up to 3 months deposits fell 4.33% in December 2010 mom and 2.77% yoy
  5. Up to 2 years deposits fell 9.64% mom and 17.32% yoy.
Not very good trends.

On credit cards, the picture is What the data suggests is:
  • Irish credit cards balances are declining, but this decline is relatively mild - down 0.81% mom in December 2010 (latest data) and -6.28% yoy.

Tuesday, February 1, 2011

1/02/2011: Growth rates in credit and deposits

Having looked at the levels of credit and deposits through December 2010 in the previous post (here) lets take a look at the rates of change.
Credit growth rates above clearly show the following trends:
  • Household loans rate of contraction has accelerated from 4.8% yoy in October and November to 5.2% in December. Thus December 2010 marked the worst month in the entire series history since 2004.
  • Rate of decline in mortgages lending was also accelerating to 1.9% in December from 1.7% in November and 1.6% in September and October.
  • Rate of decline in credit for non-financial corporations eased in December to 1.6% yoy from 2.4% in November.
Next, deposits rates of change:
The chart above shows:
  • A dramatic exist from Irish banks by non-financial corporate deposits. This flight is accelerating - having gone from -9.2% yoy fall in July, to -13.1% in August, -14.8% in September, -15.4% in October, -14.9% in November and a whooping -16.1% in December.
  • Household deposits are also accelerating in the rate of decline from -2.4% in October to -4.5% in November and -4.7% in December
To highlight these dynamics and to dispel the myth of 'savings are rising' often perpetrated by some banks analysts, let's come back to the data on deposits. In December 2008-January 2009 there was a discrete jump in household deposits to the tune of just over €12.4bn. This jump is never really noticed by the analysts, but it reflects addition of the credit unions to the database. These are not new deposits, but rather the deposits that were held in institutions previously not covered by the dataset.

Now, let' remove this 'hump' and see what the banking sector deposits really look like today:
The chart abvoe does exactly this. And it clearly shows that:
  • Over 2010, Irish households have suffered a loss of savings, not a gain, pushing our deposits to the comparable level of December 2007
  • Over the entire crisis total private sector deposits have fallen to the levels comparable to those in May-June 2006.
And yet, we keep hearing (admittedly whimpered) calls for taxing 'sky-high' deposits/savings to 'release spending into consumption markets'.

1/02/2011: Credit supply and deposits in Ireland

CBofI released monthly data for December 2010 on credit supply and deposits in the Irish financial institutions.

Updated charts and some analysis:
Irish private sector credit continued to contract in December, having fallen 0.98% mom and -10.7% yoy in total. Overall, credit outstanding fell €3.33bn in December mom and €40.23bn yoy.
Credit has fallen across all categories, except one:
  • Household credit fell 4.72% (-€6.49bn) mom and 6.41% (-€8.98bn) yoy
  • Mortgages credit fell 7.05% (-€7.55bn) mom and 9.65% (-€10.63bn) yoy
  • Non-financial corporations credit fell 2.63% (-€2.5bn) mom and 37.08% (-€54.34bn) yoy
  • Insurance and pension funds sector credit rose 5.36% (€5.66bn) and was up 26.18% (€23.09bn) yoy
  • Combined non-financial sectors and households credit fell a massive €63.32bn in 12 months to the end of December 2010.

Onto deposits next:

Headline figure is that total deposits fell 2.24% (-€3.86bn) mom and 8.41% (-€15.46bn) yoy. This was backed by deposits declines across two out of three core components:
So:
  • Household deposits rose 0.71% (€669mln) mom but fell 4.57% (-€4.53bn) yoy
  • Non-financial corporate deposits were down 5.18% (-€1.83bn) mom and 17.64% (-€7.17bn) yoy
  • Insurance and pension funds sector deposits fell 6.29% (-€2.7bn) mom and 8.57% (-€3.77bn) yoy
  • Non-financial sector and household deposits fell €11.693bn in 12 months through December 2010.
The relative changes in deposits and loans outstanding implied changes in the ratio of loans to deposits - an instrument for the leveraging taken on by the economy at large.

Overall, Irish economy achieved a very modest reduction in the ratio in 2010:
  • Total private sector credit to deposits ratio fell 2.53% in 12 months to the end of December 2010 reaching 198.81%
  • Lowest deleveraging took place in the household sector, where the ratio fell 1.93% in 12 months and currently stands at 138.56%
  • Highest degree of deleveraging was achieved in the non-financial corporate sector, where the ratio declined 23.6% yoy in December (though it rose by 2.69% mom) reaching 275.68%
  • Insurance and pensions funds sector actually increased overall leverage ratio by 38% in 12 months to the end of December, reaching the ratio of 276.6%
Overall, outstanding loans exceeded domestic deposits by 98.81% in the end of 2010.